 |
||
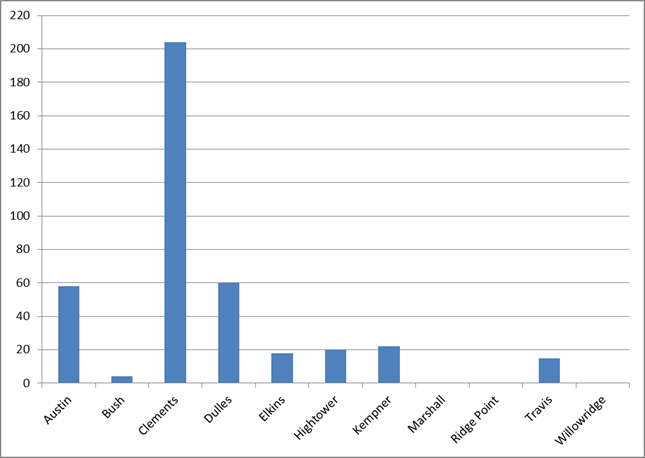
| National Merit Semifinalists | Fort Bend Independent School District (FBISD) | |||||||||||||||
| High School | 2006-2012 Total | 2012 | 2011 | 2010 | 2009 | 2008* | 2007 | 2006 | Year Opened | |||||||
| Austin | 58 | 7 | 5 | 13 | 4 | 12 | 7 | 10 | 1995 | |||||||
| Bush | 4 | 1 | 1 | 1 | 1 | 2001 | ||||||||||
| Clements | 204 | 29 | 31 | 31 | 37 | 32 | 23 | 21 | 1983 | |||||||
| Dulles | 60 | 5 | 3 | 12 | 5 | 16 | 6 | 13 | 1962 | |||||||
| Elkins | 18 | 4 | 3 | 1 | 3 | 3 | 4 | 1992 | ||||||||
| Hightower | 20 | 3 | 2 | 1 | 1 | 3 | 7 | 3 | 1998 | |||||||
| Kempner | 22 | 3 | 1 | 4 | 5 | 2 | 4 | 3 | 1988 | |||||||
| Marshall | 0 | 2002 | ||||||||||||||
| Ridge Point | 0 | 2010 | ||||||||||||||
| Travis | 15 | 2 | 5 | 3 | 5 | 2006 | ||||||||||
| Willowridge | 0 | 1992 | ||||||||||||||
| FBISD TOTAL | 401 | 50 | 51 | 67 | 59 | 69 | 51 | 54 | ||||||||
| 2006-2012 Total | 2012 | 2011 | 2010 | 2009 | 2008* | 2007 | 2006 | |||||||||
| FBISD # of seniors** | 34,735 | 5,743 | 5,120 | 4,901 | 4,721 | 4,666 | 4,634 | 4,950 | ||||||||
| FBISD: semifinalist % of seniors | 1.2% | 0.9% | 1.0% | 1.4% | 1.2% | 1.5% | 1.1% | 1.1% | ||||||||
| Clements # of seniors | 4,085 | 680 | 594 | 580 | 572 | 595 | 500 | 564 | ||||||||
| Clements: semifinalist % of seniors | 5.0% | 4.3% | 5.2% | 5.3% | 6.5% | 5.4% | 4.6% | 3.7% | ||||||||
| Clements % of FBISD semifinalists | 51% | 58% | 61% | 46% | 63% | 46% | 45% | 39% | ||||||||
| * The 2008 numbers are for "finalists" rather than "semifinalists." | ||||||||||||||||
| The finalist numbers are usually only slightly lower than the semifinalist numbers. | ||||||||||||||||
| ** Most of the senior population numbers are from here: | http://ritter.tea.state.tx.us/perfreport/aeis/2010/index.html | |||||||||||||||
| (using campus reports and district reports) | ||||||||||||||||
| Yellow: These numbers are estimates. | ||||||||||||||||
| Pink: School had no seniors and thus no semifinalists | ||||||||||||||||
|
||||||||||||||||